Trends in complaints
The complaints we review reflect the diversity of students’ experiences in higher education in England and Wales, and the wide variety of how teaching and learning is delivered. We describe the complaints we have reviewed under several broad categories, and we identify trends and patterns within the issues that different groups of students may raise. Although each student’s experience is unique, trends and data can help providers to identify interventions that may reduce the need for students to raise complaints.
Complaints received
Number of complaints received per year
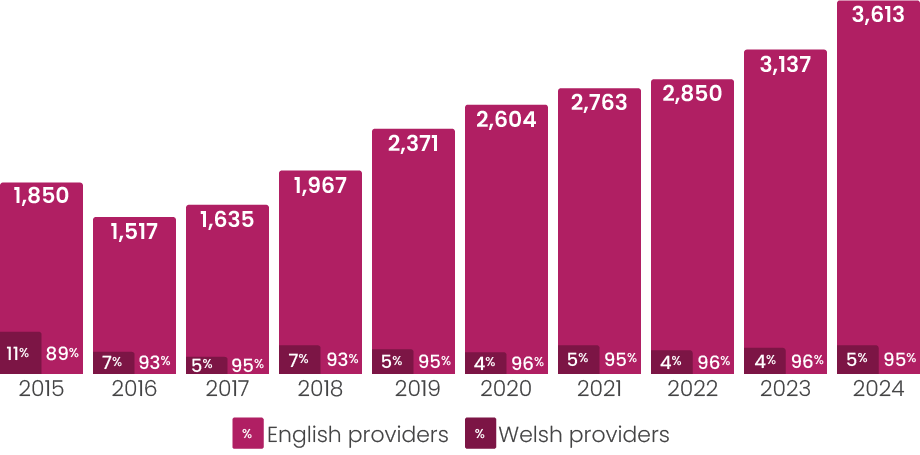
In 2024 we received 3,613 complaints, an increase of 15% on 2023. This is the ninth consecutive year that complaints have increased. The increase of 476 complaints is the largest year-on-year increase in the last decade. The proportional rise we have seen in complaint receipts is greater than that in the total student population. The increase in complaints coming to us does not necessarily indicate an overall rise in student dissatisfaction. It could equally indicate improvements in the accessibility of internal complaints processes, or in signposting to us. We will continue to monitor overall numbers of complaints, particularly in the light of financial challenges in the sector that may impact on students’ experiences.
The proportion of complaints about providers in England and Wales remains consistent with previous years.
Complaints received by area of study – Top 10
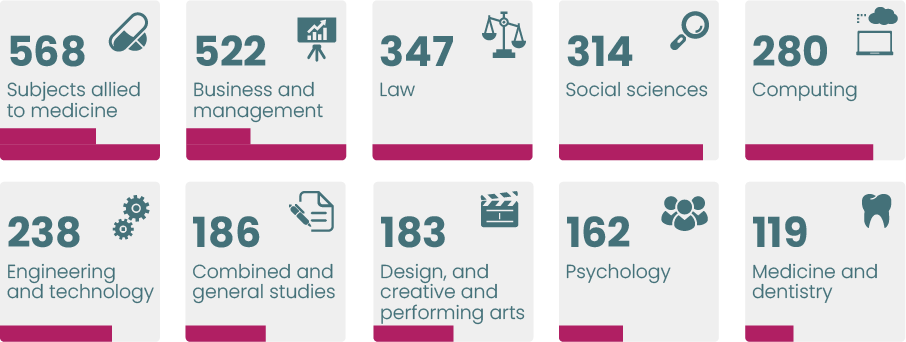
The distribution of complaints across different areas of study has strong correlation to the number of students studying within those fields. We see a higher volume of complaints from students whose courses are linked to a particular career path, where their studies may involve work placements or where providers may have to take account of professional standards. Some areas of study rely upon more specialist materials and resources, and this can result in more complaints if these are in short supply or if some students find it difficult to access them. Some areas of study may also have higher numbers of postgraduate or international students.

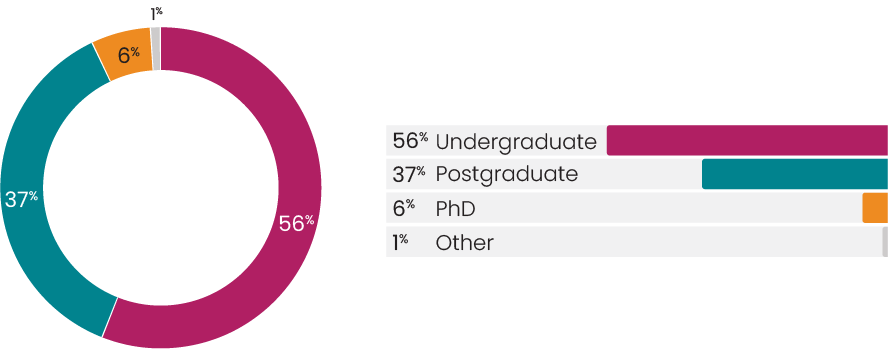
Complaints received by level of study
Complaints received by student domicile
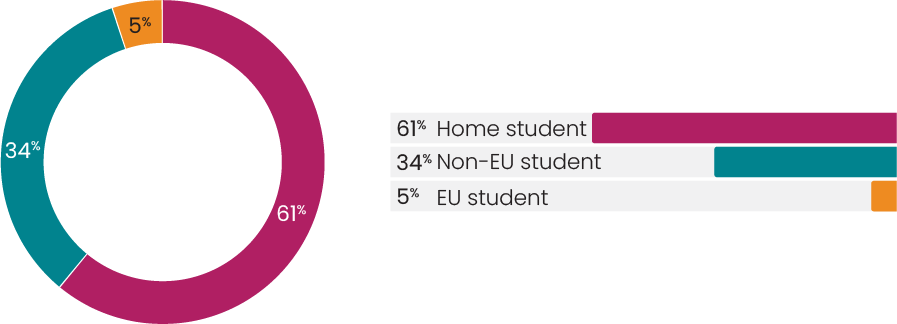
As in previous years, international students continue to be over-represented in the complaints that we received in 2024. Although there have been some changes to the visa system for international students and fluctuations in how successful English and Welsh providers have been in attracting international students, we have not seen any direct impact within our casework yet. International students continue to place a high value on the opportunity to study in the UK and the opportunity to work here following the successful completion of their studies. The financial and personal costs to international students of not completing their studies successfully can be very high. It is important that providers reflect upon international students’ complaints and identify opportunities to improve the clarity of the information given to support successful outcomes from their studies.
Complaints received by category
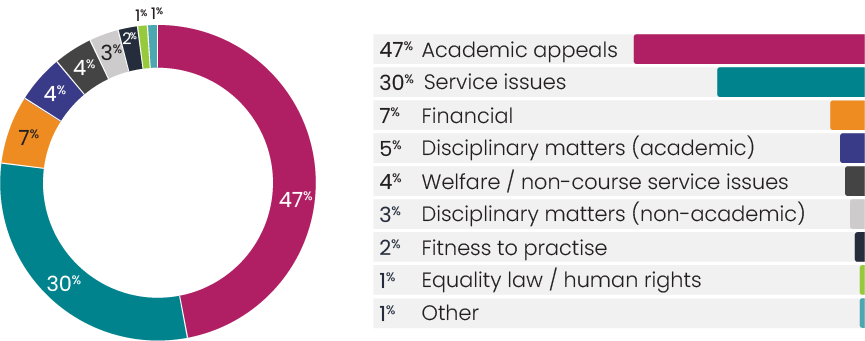
We categorise complaints under nine broad headings. Complaints about the outcome of an Academic appeal process include a range of decisions about progression on to the next part of a course, whether a student may be permitted a re-sit opportunity, and the calculation of degree classifications. The category of “Service issues” includes a variety of complaints about the delivery of teaching and learning opportunities, including arrangements for students undertaking time in placement settings and support for disabled students. Over the last ten years, between 73% and 79% of our complaints have fallen within these two categories.
Until 2019, academic appeals were consistently the largest category of complaints. Between 2020 and 2022 complaints about service issues were in the majority, driven by the disruption caused by the Covid-19 pandemic and student dissatisfaction following industrial action. In 2023 and 2024, we have seen a return to the more familiar distribution of complaints.
Most complaints we review are brought to us by individual students. We have continued to receive a small number of complaints brought by students acting as a group. Most group complaints are categorised as being about “service issues”. In 2024 we received 24 group complaints. Most of these groups consisted of fewer than ten students. We did not receive any group large enough to require use of our large group complaints process.

Complaints closed
The outcome of complaints

We upheld all or part of the student’s complaint or negotiated a settlement that was acceptable to the student in 24% of our cases. In a further 8% of cases, the provider had made an offer to resolve the complaint that we considered reasonable, and in these cases the offer was usually still open to the student at the conclusion of our review. We are pleased that most providers engage constructively with conversations to explore settlement, recognising the benefits to students and to the provider of reaching an outcome swiftly and informally.
There are some significant differences in the distribution of complaint outcomes within our case categories. For example, we did not uphold 78% of the academic appeal cases that were eligible for review, deciding that they were Not Justified. This was similar for academic disciplinary cases, where 76% of eligible cases were not upheld. In general, we consider that academic appeal and academic misconduct processes are well established and understood by the staff operating them.
Complaints within these categories are also more likely to be focused on a limited number of events or events that took place within a short timeframe. In a high proportion of these cases, we conclude that the decision the provider reached was in line with its regulations and procedures and was a fair outcome.
For complaints about financial matters, we did not uphold 75% of the eligible complaints. However, we agreed a settlement in slightly more than 20% of the eligible complaints. This may reflect that it is usually relatively simple to establish facts as to a student’s financial status and to identify and apply the relevant rules. Where we identify an error in the process, providers will rapidly agree to put the matter right.
In contrast, complaints about service issues, welfare issues and non-academic disciplinary issues are often wide ranging and highly complex. In some cases, students’ circumstances have been considered under several different processes over several months which leads to increased likelihood of delay or procedural errors. Of the complaints about service issues that were eligible for review, just over 17% were upheld in full or in part, and just under 30% were settled. A further 20% of cases were found to be Not Justified because a reasonable offer had been made by the provider, either at the end of the internal complaints process or during our review. This means that two-thirds of students who complained to us about service issues received some remedy in response to their original complaint.
“I want to extend my heartfelt thanks to you and the entire OIA team for taking up my complaint and resolving it so swiftly. After waiting for three years, I am overjoyed that my issue was resolved in just a few weeks with your involvement. Your dedication and efficiency are truly commendable. Thank you once again for your wonderful support.”
“Thank you so much for your patience, for listening to my concerns, and for your dedication in what was a very challenging case. Thanks to your work, I can finally put this difficult chapter behind me. I am truly grateful for the clarity and resolution that was achieved. Please know that your efforts have had a significant impact, and I sincerely appreciate everything you did to bring this matter to a fair conclusion.“

